10. Behaviour analysis
The behaviour analysis combines three sources for every fly: its position from the video tracking, its sips and feeding bouts from the FlyPad, and its OptoPad stimulation. It answers questions the feeding analysis alone cannot: how much a fly walks, where it spends its time, how often it visits each food and whether it feeds there, what it does after a feeding bout, and how stimulation changes its walking.
It is separate from the feeding analysis (Analyze): it uses the same sip detection, but never changes the feeding results.
What it needs
- A FlyPad recording with its video, and the flies’ positions: from live tracking during the recording, or from Track flies in video… in Review. If both exist, the offline tracking is used, unless you tick Use the live tracking positions….
- The arenas (saved with the video by live tracking or by Track flies).
- Optional: the OptoPad events (
_events.csv) and the labels (Log_…txt) of the recording.
Run it
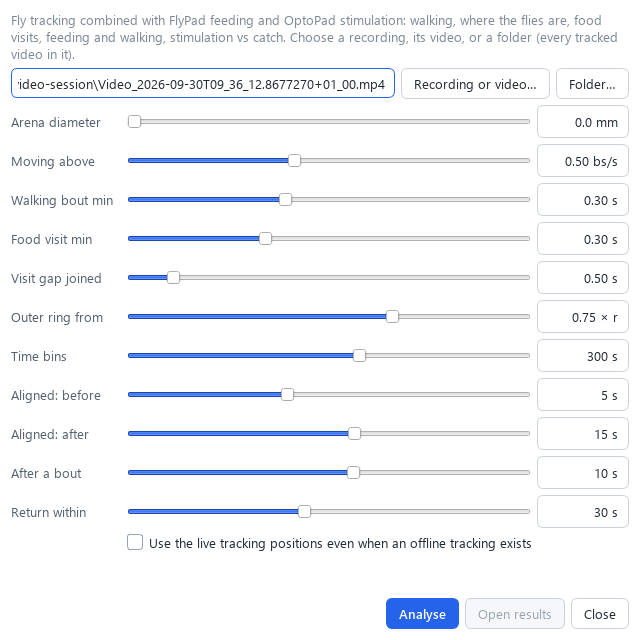
Choose Analysis → Behaviour analysis (tracking + FlyPad + OptoPad)…, or Behaviour analysis… in Review. Choose a recording or its video, or a folder: every tracked video in it is analysed together, and flies are grouped by the recording’s conditions. Click Analyse. The analysis runs in the background; Open results opens the results folder when it is done.
| Setting | Meaning |
|---|---|
| Arena diameter | Floor diameter of an arena in mm, for results in mm. 0 = results in pixels and body sizes only |
| Moving above | A fly is moving when faster than this many body sizes per second |
| Walking bout min | The shortest walking bout; shorter stops are joined |
| Food visit min | The shortest food visit |
| Visit gap joined | Absences from the food shorter than this do not end a visit |
| Outer ring from | Outer ring (thigmotaxis) = beyond this part of the arena radius |
| Time bins | Bin length of the over-time tables and figure |
| Aligned: before / after | Event-aligned speed traces run from this long before to this long after each event |
| After a bout | Distance walked in this time after each feeding bout |
| Return within | Counts returns to the same food within this time |
Body sizes are the fly’s own length scale (the square root of its median area in the image), so speeds compare between flies and setups without calibration.
Results
Everything goes into Behavior_<name> next to the data:
| File | Content |
|---|---|
Behavior.xlsx |
README (every measure explained), Settings, Flies (one row per fly), Conditions (means per condition), StimVsCatch, TimeBins, Visits, Sips, Trials, OpenLoopSteps, Sessions |
frames_<session>.csv |
Every position of every fly: time, smoothed position, speed, zone |
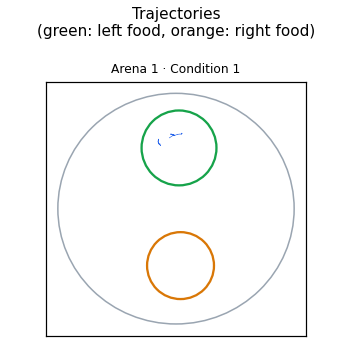
| Figures | Trajectories, occupancy maps, speed over time, event-aligned speed, measures by condition, stimulation vs catch |
Measures
| Measure | Meaning |
|---|---|
| tracked_% | Time the fly was found. assumed_still_%: before it was first found, it is placed where it was first found (it sat still since tracking started) |
| distance, moving_%, speed_moving | Path length, time moving, and speed while moving |
| walking_bouts, walking_bout_s | Number and mean duration of walking bouts |
| outer_ring_%, on_wall_%, radius_mean | Where in the arena: near the wall (thigmotaxis), or on average how far from the centre (0 = centre, 1 = edge) |
| on_L_% / on_R_% | Time on the left / right electrode |
| visits, visit_s, first_visit_s, first_sip_s | Food visits per electrode: number, mean duration, latency to the first visit and the first sip |
| feeding_visits_% | Visits with at least one sip on that electrode |
| occupancy_PI, sip_PI | (L − R) / (L + R) of time on the electrodes, and of sips |
| sips_on_their_electrode_% | Sips during which the fly was on the electrode that recorded them. A quality check: close to 100 % means the video and FlyPad are in sync and the channels are right |
| speed_in / out_bouts | Speed inside and outside feeding bouts |
| after_bout_distance_bs | Distance walked after each feeding bout (local search) |
| returns_same_food_% | After leaving the food following a bout, back on the same food within Return within |
| stim_… / catch_… | OptoPad: the same measures inside the fly’s stimulation periods and inside its catch periods (when the coin flip said no), per minute of each |
| …_trial_speed_change, …_trial_leaves_food_s | Per trial: speed after minus before; for trials on food, time until the fly left it |
The StimVsCatch sheet compares each fly’s stimulation and catch values with a paired Wilcoxon signed-rank test (from 5 flies). OpenLoopSteps gives speed, time moving, time on food and sips per minute for each step of an open-loop schedule.
Notes
- Times are recording seconds, the same time axis as the feeding analysis and the OptoPad events.
- Flies that were never found are listed in Sessions → notes: they sat still from the start of tracking, or the arena was drawn in the wrong place.
- Positions marked filled are assumed: the fly sat still where it was last seen.