9. Analyze: feeding analysis
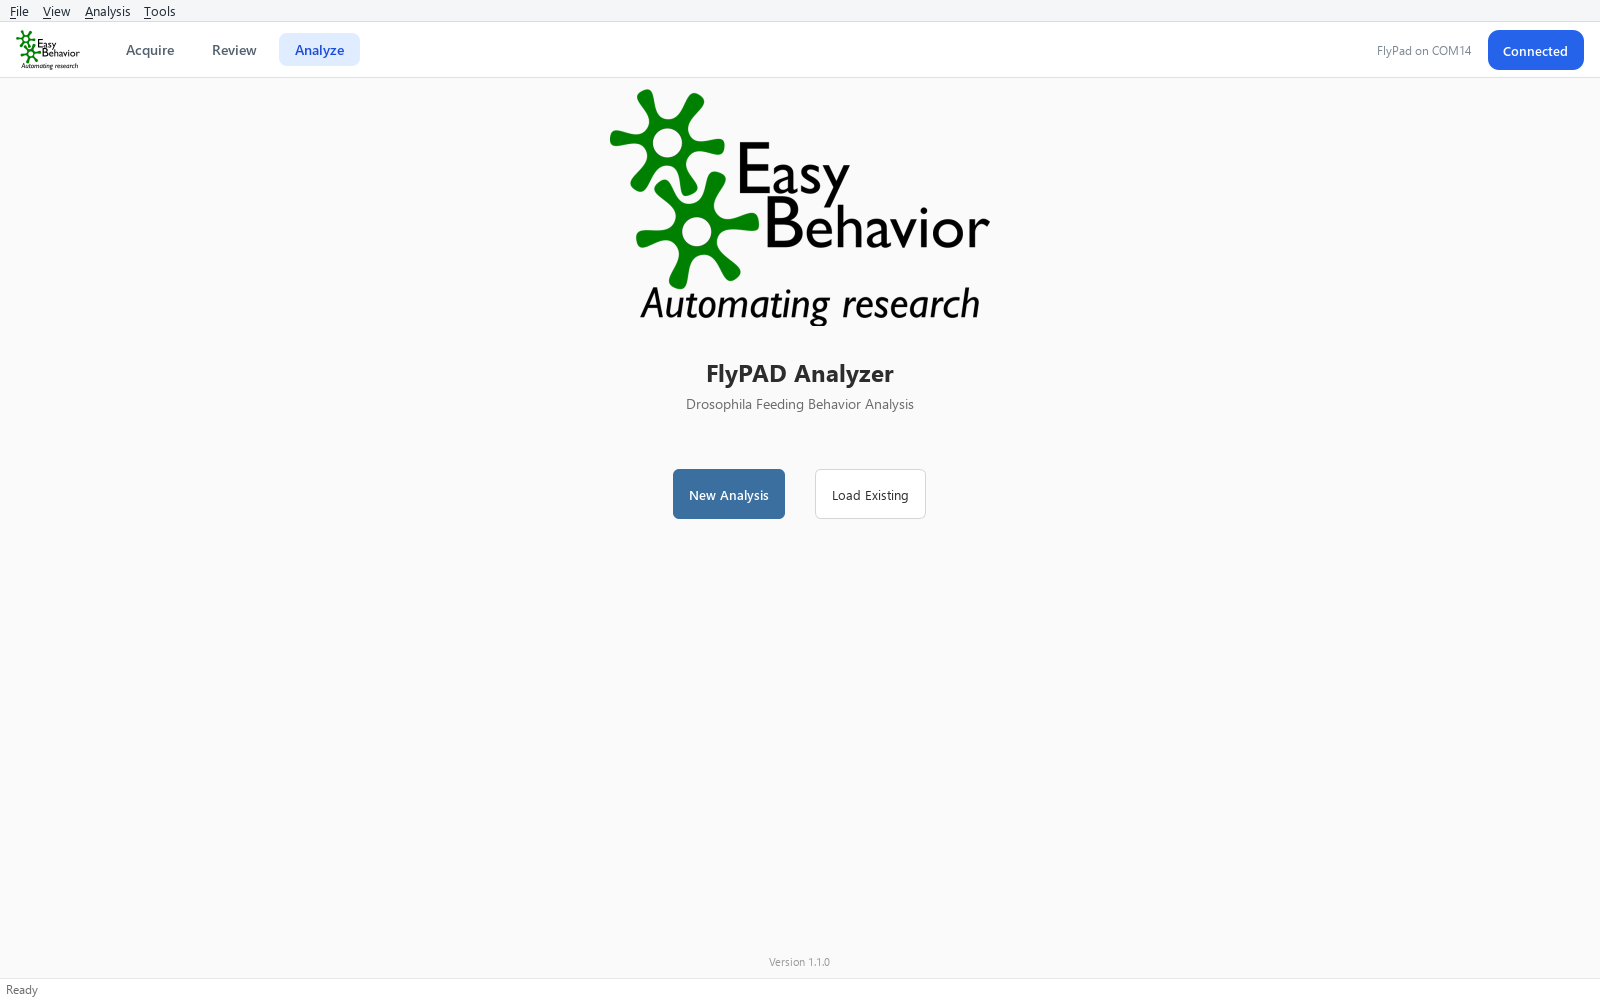
The Analyze page turns recordings into feeding measures, statistics, figures and Excel
tables. One analysis can combine several recordings. It analyses every CapacitanceData file
in the chosen folder, so a folder holds one complete experiment.
Start an analysis
- From Review: Analyze this recording → (recommended; the folder and labels are pre-filled).
- On the Analyze page: New Analysis, or Analysis → New analysis… (Ctrl+N).
- To reopen a finished analysis: Load Existing or Analysis → Load analysis results… (Ctrl+L).
The setup wizard
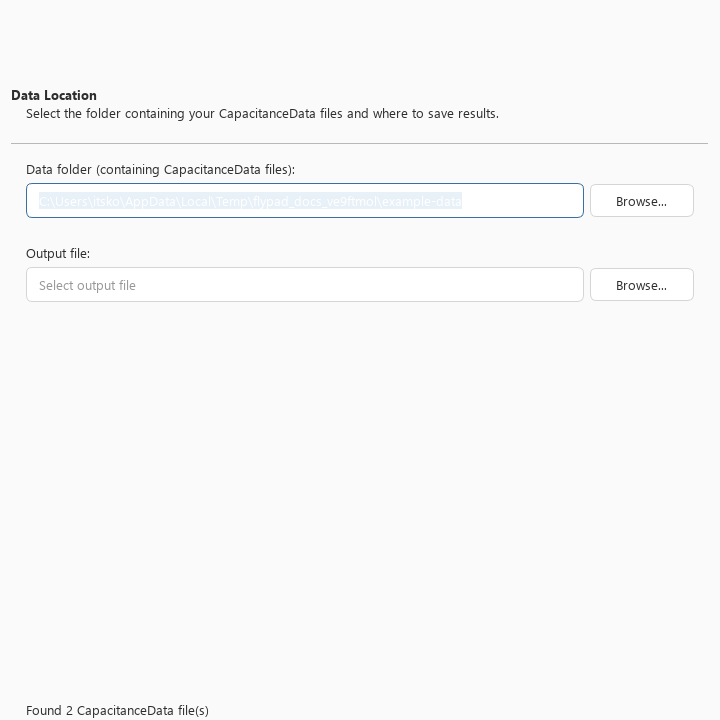
1. Data Location. The folder with your CapacitanceData files; the wizard reports how many
it found. Optionally, choose an output file to save the analysed events for later.
2. Hardware Configuration.
| Setting | Use for |
|---|---|
| 32 flies | 64 channels, two foods per fly (earlier FlyPad, two-choice) |
| 64 flies | 64 channels, one food per channel |
| 48 flies | 96 channels, two foods per fly (current FlyPad, two-choice) |
| 96 flies | 96 channels, one food per channel |
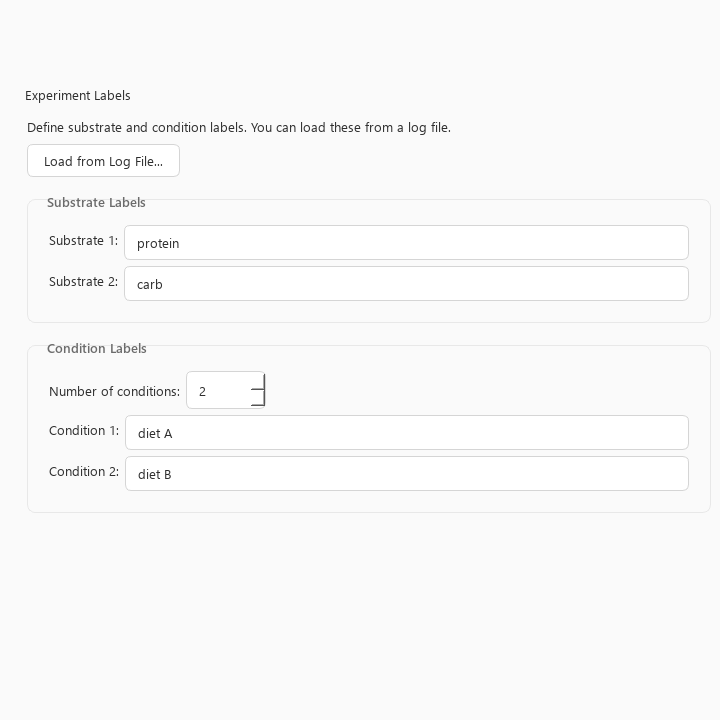
3. Experiment Labels. Food (substrate) and condition names. They are filled in from the
Log_…txt file saved with the recording; Load from Log File… reads another one.
4. Analysis Parameters. The defaults suit most experiments:
| Parameter | Default | Meaning |
|---|---|---|
| Duration (samples, 100 Hz) | 360000 | Length analysed from the start of each recording; 360000 = 60 min. Set it to your assay length, e.g. 300000 for 50 min |
| Cumulative bin size (samples) | 1000 | Time step of the cumulative plots and tables; 1000 = 10 s |
| RMS window size | 300 | Window for detecting activity bouts; 300 = 3 s |
| Equality factor | 0.5 | Sip detection: how similar the touch and release steps must be |
| RMS threshold | 1.0 | Activity bout detection threshold |
| Min / Max sip duration (samples) | 4 / 100 | Accepted sip length: 40 ms to 1 s |
| Channels to remove | — | Channels to exclude, e.g. 5 17 40 |
| Remove non-eaters | off | Excludes flies with 2 or fewer activity bouts on both foods |
| Spill quality control | off | Excludes channels whose signal was saturated too often (spilled food) |
| Stim vs catch: rate from / to, count over, bin (s) | 10 / 30, 10, 1 | Windows of the stim vs catch trial figures (OptoPad recordings with catch trials only) |
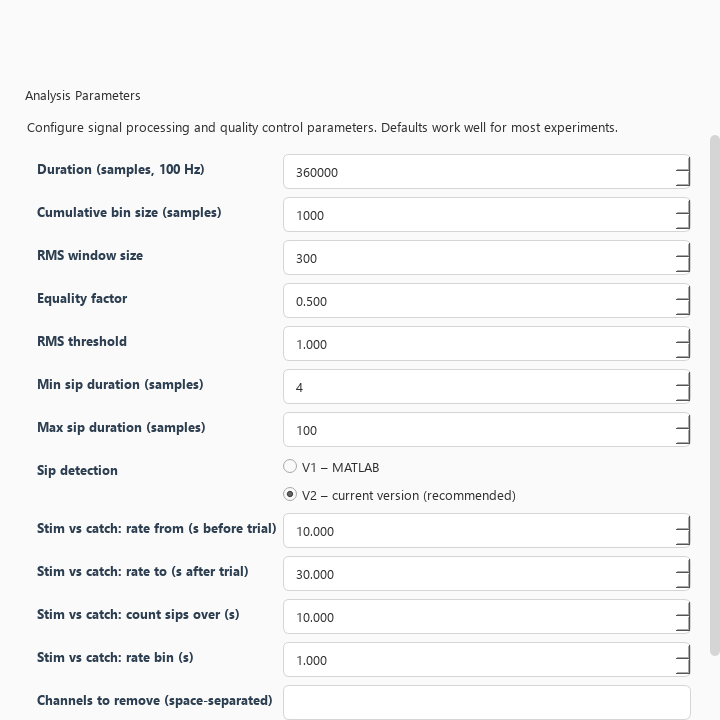
Sip detection. The same page offers two versions (also in Analysis → Sip detection; the choice is remembered):
- V2 – current version (recommended): a sip’s touch and release steps must be of similar size, and the activity threshold adapts to the noise of each channel. This removes onsets placed about 100 ms early on detrending echoes, and spurious sips.
- V1 – MATLAB: identical to the MATLAB analysis, for comparing with results analysed there.
5. Review Settings. A summary. Click Finish to run.
Data checks
When processing finishes, a Data checks window lists anything unusual. The same list is
saved as AnalysisWarnings.txt with the results.
| Check | What the analysis does |
|---|---|
| A recording is shorter than Duration | Only the recorded time is analysed. After the recording’s end, its time courses are left empty rather than counted as “no feeding” |
| USB dropouts (gap-filled frames) | The dropouts are treated as no signal: no false sips at their edges |
| Channels without a condition in the file name | They are listed and not analysed |
| A file name without condition tags | All channels are analysed as one condition |
| File names that do not fit the hardware configuration | A warning when the name uses channels the configuration does not have, e.g. channel 96 with a 64-channel configuration |
| Signals that jump between sensors at every sample | A warning: the file was recorded with the other channel count (64 or 96) - choose the matching configuration. Judged from the data, so systems using only a few arenas of a 96-channel board are not affected |
| An empty or incomplete file | It is skipped, or its incomplete last frame is ignored |
When the conditions have their own food pairs (see Acquire), each plot and table shows each condition’s foods. Plots of one side are titled Food 1 (left) / Food 2 (right), and the preference index is labelled with each condition’s pair, e.g. C01 (1 mM sucrose vs 2 mM sucrose).
Long recordings (days)
Recordings of several days are analysed like any other. Set Duration to the recording length in samples: 360,000 per hour, e.g. 25,920,000 for 3 days (the maximum is 11.6 days).
- Memory. The file is never loaded whole. It is read in parts, a group of channels at a time, and each channel is analysed over its full length, so the results are the same as for a short file. A long recording is processed by several channels in parallel, as many as the processor cores and 60 % of the free memory allow (3–4 GB per channel for 3 days). A PC with little free memory simply uses fewer and takes longer; it never runs out of memory.
- Time. A 3-day, 96-channel recording on an 8-core PC with 32 GB: about 4 minutes of processing and 3½ minutes to write the figures, Excel and CSV files.
- Time-resolved per-fly workbooks (10-s bins): Excel holds at most 16,384 columns (45.5 h).
For longer recordings the same grids are written as CSV files in the folder
TimeResolvedCSV(one file per sheet, one row per fly, one column per 10-s bin, full precision), readable by MATLAB, Python, R or Prism. The analysis log says so.
Results
Processing takes seconds to a few minutes. Then the results viewer opens: plot categories on the left, the selected plot on the right.
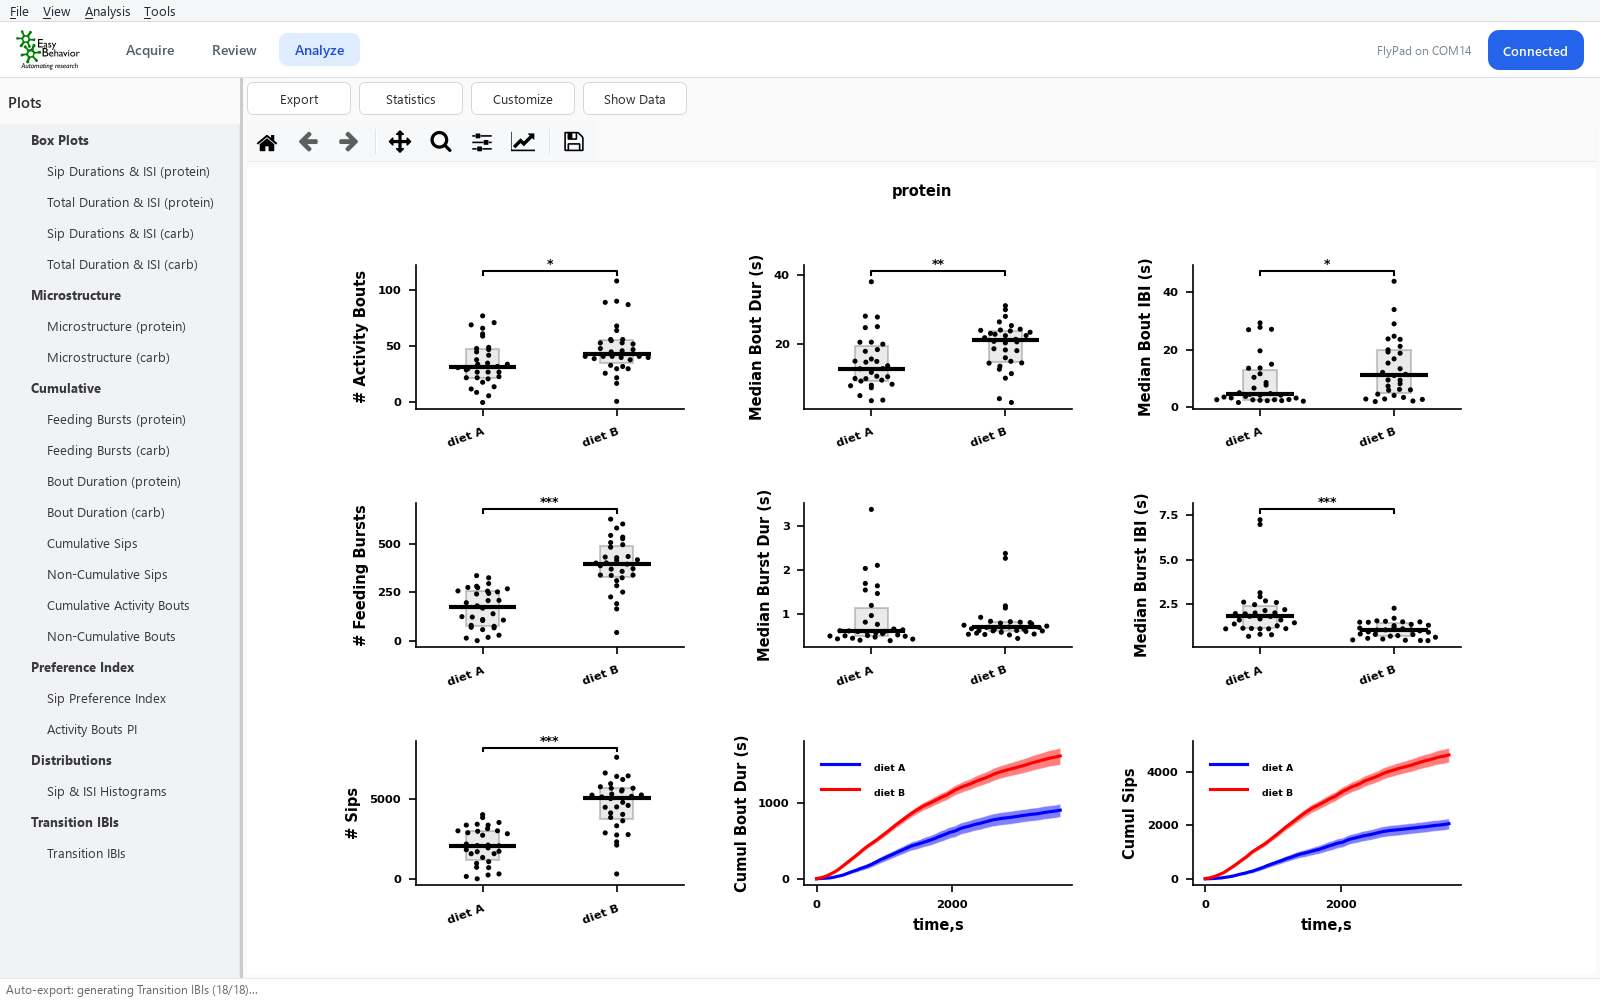
| Category | Plots |
|---|---|
| Box Plots | Sip durations, inter-sip intervals and their totals, per condition and food |
| Microstructure | Number of sips, activity bouts, feeding bursts and their durations and intervals |
| Cumulative | Sips, feeding bursts and activity bouts over time |
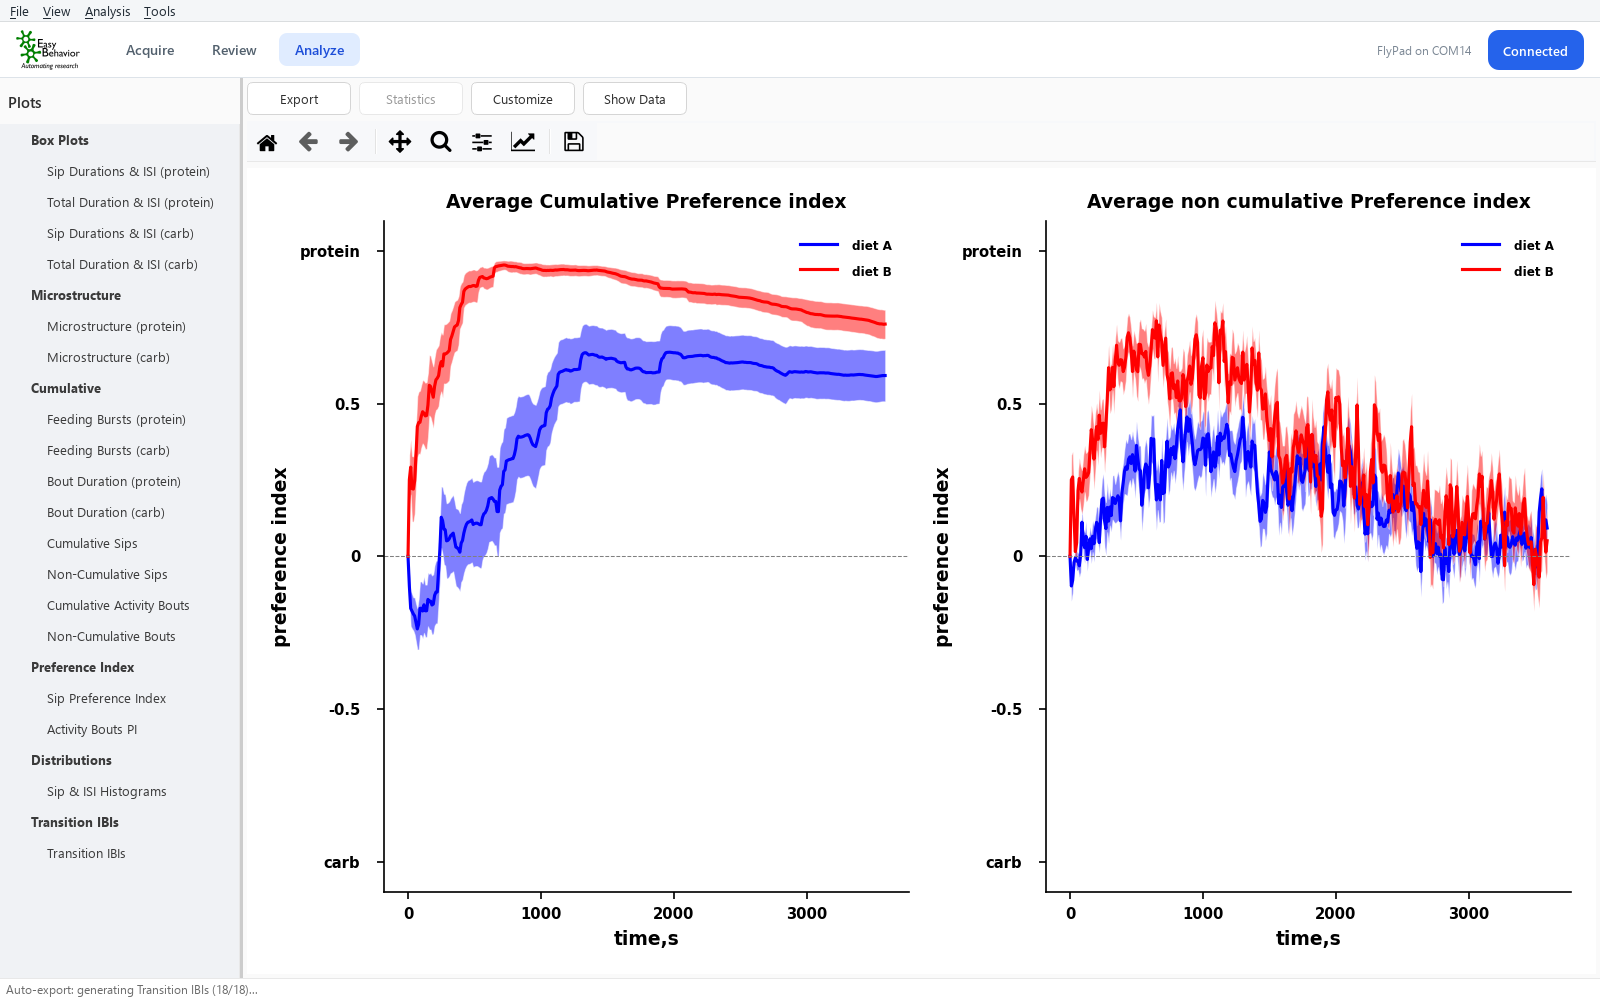
| Preference Index | Food preference over time, from sips and from activity bouts |
| Distributions | Histograms and cumulative distributions of sip durations and intervals |
| Transition IBIs | Intervals between switches from one food to the other |
| Stim vs catch: trials / periods | Only for OptoPad recordings with catch trials, see below |
Above each plot:
- Export saves the figure.
- Statistics shows the tests between conditions.
- Customize changes colours, labels and fonts.
- Show Data shows the numbers behind the plot.
Stimulation vs catch
When a recording was made with an OptoPad Probability below 1 (see
OptoPad), the analysis reads its
…_events.csv and compares, per fly, the moments that were stimulated with the matched
moments that were not (catch trials). Each fly is compared with itself (paired Wilcoxon
test, flies with at least one stim and one catch trial); the p value and n are printed on
the figures. These figures are not in the Statistics window, which compares conditions.
Stim vs catch: trials — aligned to each trial moment, on the channel that triggered:
- Peri-trial sip rate: sips per second from −10 to +30 s, stim and catch curves (mean ± SEM over flies) per condition.
- Trial measures: sips in the 10 s after the trial; time until feeding stops (end of the current activity bout, 0 if the fly was not feeding); latency to feed again (from the end of that bout to the next one). Each fly’s value is the mean over its trials.
The windows are set in the wizard (Stim vs catch rows).
Stim vs catch: periods — everything the fly did during stim periods vs during catch periods, stim and catch side by side per condition, each fly’s two values joined:
- every box-plot and microstructure measure, per food;
- the preference index (sips and activity) and transition IBIs;
- sip-duration and inter-sip histograms.
How the periods are counted:
- With two foods, both channels of a fly share its periods (the LED lights the arena). This holds even when you remove one of the two channels.
- USB dropouts are cut out of the periods: they count neither events nor time.
- An event belongs to the period in which it starts. An interval (between sips, bouts or bursts) counts only when both ends lie in the same period.
- Counts and totals are per minute of period (a fly may have more catch time than stim time); medians are unchanged.
- The recording-long cumulative time courses are not repeated for stim vs catch: periods are short and scattered, so such a curve would mostly show when trials happened. The peri-trial sip rate is the time course aligned to the trial instead.
- A recording with stimulations but no catch rows (probability 1, or recorded before catch trials were logged) gets a Data checks warning and no stim vs catch figures.
All numbers are saved in StimVsCatchInExcelFormat.xlsx: one row per trial (Trials), per-fly
means (PerFly), minutes and number of periods per fly (Periods), the peri-trial curves
(PeriTrialRate), every period measure per fly (PeriodMetrics) and the tests (Stats).
Saved outputs
Every analysis automatically saves all figures and tables to figures and datasheets in the
data folder:
| File | Content |
|---|---|
DataInExcelFormat.xlsx |
One value per fly for every measure, by condition and food |
StatsInExcelFormat.xlsx |
Statistics between conditions |
CumulativeFeedingInExcelFormat.xlsx, NONCumulativeFeedingInExcelFormat.xlsx |
Sips over time, per fly (cumulative and per bin) |
CumulativeBouts…, CumulativeFeedingBursts… |
The same for activity bouts and feeding bursts |
CumulativePI…, NONCumulativePI…, …BoutsPI… |
Preference index over time, per fly |
SipDurationHistograms…, SipIFIHistograms… |
Histograms per fly |
StimVsCatchInExcelFormat.xlsx |
OptoPad catch trials only: stim vs catch trials, periods and tests |
*.png |
Every figure |
events_data.npz |
All detected events, to reload the analysis later |
Extra per-fly outputs (identical to the MATLAB “extra outputs” analysis):
| File | Content |
|---|---|
Cumulative… / NONCumulative… NumberOfTransitionIBIs, TransitionIBIDuration, ActivityBoutDuration, ActivityBoutIBI InExcelFormat.xlsx |
Time courses per fly (rows = flies, columns = 10 s bins), laid out like CumulativeFeedingInExcelFormat.xlsx |
FlyIndexInExcelFormat.xlsx |
Which run and channel each row is; time of each column; quality check |
TransitionSequence.csv / …InExcelFormat.xlsx |
Every visit of every fly to either food, in order, with times: the A → B → A → A sequence |
TransitionSequenceStrings.xlsx |
One line per fly, e.g. ABBAAAB… |
TransitionMatrixInExcelFormat.xlsx |
Per fly: counts and probabilities of A→A, A→B, B→A, B→B |
Rows marked IsPhantomRow = 1 in FlyIndexInExcelFormat.xlsx are padding, not flies. Drop
them before statistics.
Statistics and the preference index
PI = (sips on A − sips on B) / (sips on A + sips on B) ranges from +1 (only A) to −1 (only B). The analysis adds 1 to each count, (A − B) / (A + B + 2), so that flies that barely fed sit near 0 instead of at ±1.
The Statistics window compares conditions with one value per fly: the Mann–Whitney U test between each pair of conditions (optionally Bonferroni or Holm corrected), the Kruskal–Wallis test or one-way ANOVA across all conditions, and Cliff’s delta and Cohen’s d as effect sizes.