Each FlyPAD arena gives a fly two small food electrodes. The capacitance of an electrode jumps every time the fly touches the food with its proboscis, and changes more slowly when it stands on or next to the electrode. The analysis turns this signal into events - sips, visits (activity bouts) and feeding bursts - and from them into one value per fly for every metric described here.
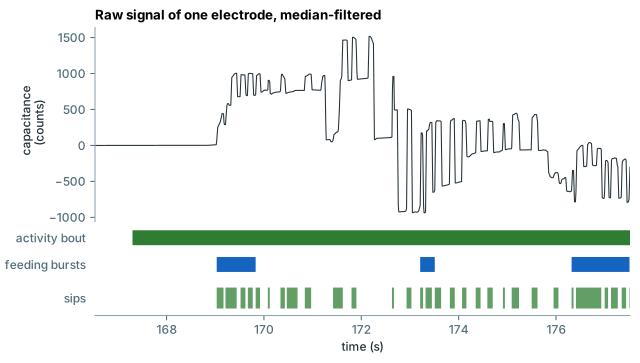
Two versions of sip detection
Choose the version in Sip detection (menu) or in the setup wizard. Compare results only within one version.
V2 - current versiondefault
A sip's rise and fall must be of similar size (rise at least 0.5 × the fall, and the fall at least 0.5 × the rise). The activity threshold adapts to the noise level.
Synthetic recordings with known sips: 98% found at the right onset, durations within 10 ms; no false sips from noise.
V1 - MATLAB
Identical to the MATLAB analysis (ProcessDataDamPAD), for comparison with results analysed in MATLAB.
The drift removal leaves small echoes of every step; V1 takes some of them as sip onsets (about 12% of sips start ~100 ms early) or pairs them into spurious sips (about 10%).
How values are counted
- Events (sips, bouts, bursts) are detected per electrode; times are in seconds (1 sample = 10 ms).
- Per-fly metrics summarise the events of one fly on one substrate: counts, totals or medians.
- A fly without events counts as 0 for counts and totals, and is left out of medians (a median of nothing is undefined) - as in MATLAB.
- Removed flies (non-eaters, spill quality, flies to remove) are left out of every plot, table and test.
- Statistics always compare one value per fly between conditions.
All metrics
| Metric | One value per | Unit | Topic |
|---|---|---|---|
| Trimmed recording | per channel | samples | Signal processing |
| Median-filtered signal | per sample | counts | Signal processing |
| Detrended trace R | per sample | counts | Signal processing |
| Activity (RMS) mask | per sample | true/false | Signal processing |
| Sip onset / offset | per sip | sample | Sips |
| Sip duration | per sip | s | Sips |
| Inter-sip interval (IFI / ISI) | per pair of consecutive sips | s | Sips |
| In-burst / isolated sips | per sip | sample | Sips |
| Activity bout onset / offset / duration | per bout | sample, s | Activity bouts |
| Activity bout IBI | per pair of consecutive bouts | s | Activity bouts |
| Active samples | per sample | samples | Activity bouts |
| Feeding burst | per burst | sample | Feeding bursts |
| Burst duration / sips per burst / burst IBI | per burst | s, count, s | Feeding bursts |
| Bursts per activity bout | per activity bout | count | Feeding bursts |
| Insider IBI | per gap between bursts inside one activity bout | s | Feeding bursts |
| Burst latency | per activity bout | s | Feeding bursts |
| Spill quality / unconnected / out of range | per channel | fraction 0-1 | Quality control and fly removal |
| Fly removal | per fly / channel | - | Quality control and fly removal |
| Number of sips | per fly | count | Per-fly summary metrics |
| Median sip duration | per fly | s | Per-fly summary metrics |
| Median inter-sip interval | per fly | s | Per-fly summary metrics |
| Total sip duration | per fly | s | Per-fly summary metrics |
| Total inter-sip intervals | per fly | s | Per-fly summary metrics |
| Number of activity bouts | per fly | count | Per-fly summary metrics |
| Median activity bout duration | per fly | s | Per-fly summary metrics |
| Median activity bout IBI | per fly | s | Per-fly summary metrics |
| Total activity bout duration | per fly | s | Per-fly summary metrics |
| Number of feeding bursts | per fly | count | Per-fly summary metrics |
| Median burst duration | per fly | s | Per-fly summary metrics |
| Median burst IBI | per fly | s | Per-fly summary metrics |
| Median burst latency / bursts per bout / insider IBI | per fly | s, count, s | Per-fly summary metrics |
| Transition IBI | per transition | s | Substrate transitions |
| Number of transitions / median transition IBI | per fly and direction | count, s | Substrate transitions |
| Visit sequence / transition matrix | per fly | - | Substrate transitions |
| Cumulative sips / feeding bursts | per fly and time bin | count | Time courses |
| Cumulative activity | per fly and time bin | s | Time courses |
| Non-cumulative (per bin) | per fly and time bin | count or s per bin | Time courses |
| Preference index (sips, activity) | per fly and time bin | -1 .. 1 | Time courses |
| Time-resolved per-fly parameters | per fly and time bin | count or s | Time courses |
| Sip duration / inter-sip interval histograms | per bin | count per fly | Distributions |
| CCDF | per value | fraction | Distributions |
| Descriptive statistics | per condition | - | Statistics |
| Pairwise test | per pair of conditions | p | Statistics |
| Omnibus tests | per metric | p | Statistics |
| Effect sizes | per pair of conditions | -1..1 / SD units | Statistics |
| Peri-trial sip rate | per fly and time bin | sips/s | Stimulation vs catch |
| Sips after the trial | per trial / per fly | count | Stimulation vs catch |
| Time until feeding stops | per trial / per fly | s | Stimulation vs catch |
| Latency to feed again | per trial / per fly | s | Stimulation vs catch |
| Stim and catch periods of a fly | per fly | samples | Stimulation vs catch |
| Box-plot and microstructure metrics within periods | per fly | per minute or s | Stimulation vs catch |
| Paired Wilcoxon test | per condition and measure | p | Stimulation vs catch |