Per-fly summary metrics (box plots, statistics, Data/Stats tables)
One value per fly and substrate. Counts and totals of a fly without events are 0 (fly kept); medians of no events are undefined (fly left out) – as MATLAB. Box plots: box = quartiles (MATLAB prctile), line = median (red when > 50 flies), dots = flies spread as MATLAB plotSpread.
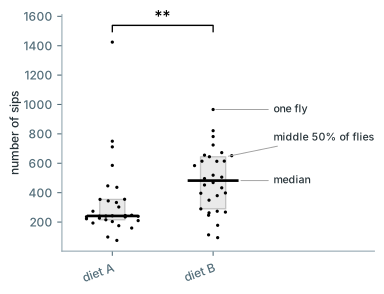
Number of sips
Number of detected sips.
InterpretationMain proxy of food intake (number of proboscis contacts). Depends on the detection version (V2 ≈10% fewer than V1 on the sample data).
Code:
analysis/statistics.py::n_sips · fingerprint 6de393b9bd79Median sip duration
Median of the fly's sip durations.
InterpretationTypical contact time per sip.
Code:
analysis/statistics.py::median_sip_duration · fingerprint 5f3ccbc35a12Median inter-sip interval
Median of the fly's IFIs.
InterpretationTypical rhythm of feeding; shorter = faster, more regular feeding.
Code:
analysis/statistics.py::median_ifi · fingerprint 5f893ec021a0Total sip duration
Sum of the fly's sip durations.
InterpretationTotal contact time with the food by the proboscis; with number of sips the best intake proxy.
Code:
analysis/statistics.py::total_sip_duration · fingerprint 851158f9cd45Total inter-sip intervals
Sum of the fly's IFIs.
InterpretationTime spent between sips, including long pauses.
Code:
analysis/statistics.py::total_ifi_duration · fingerprint 2e3ab6daec84Number of activity bouts
Number of activity bouts.
InterpretationHow often the fly engaged with this food (visits).
Code:
analysis/statistics.py::n_bouts · fingerprint 44b4a83110a1Median activity bout duration
Median of the fly's bout durations.
InterpretationTypical visit length.
Code:
analysis/statistics.py::median_bout_duration · fingerprint 09c54c900b5eMedian activity bout IBI
Median of the fly's bout IBIs.
InterpretationTypical time between visits.
Code:
analysis/statistics.py::median_bout_ibi · fingerprint f186d9716318Total activity bout duration
Sum of the fly's bout durations.
InterpretationTotal engagement time with this food.
Code:
analysis/statistics.py::total_bout_duration · fingerprint 39488e7666aaNumber of feeding bursts
Number of feeding bursts.
InterpretationHow often sustained feeding started.
Code:
analysis/statistics.py::n_bursts · fingerprint d89ae1334638Median burst duration
Median of the fly's burst durations.
InterpretationPersistence of feeding episodes.
Code:
analysis/statistics.py::median_burst_duration · fingerprint 50f42d23a4c5Median burst IBI
Median of the fly's burst IBIs.
InterpretationTypical pause between feeding episodes.
Code:
analysis/statistics.py::median_burst_ibi · fingerprint ba2ab74742c7Median burst latency / bursts per bout / insider IBI
Medians of the per-bout values (Feeding bursts section); tables only, no plots.
InterpretationSee Feeding bursts.
Code:
analysis/statistics.py::median_burst_latency, analysis/statistics.py::median_bursts_per_bout, analysis/statistics.py::median_insider_ibi, analysis/statistics.py::seconds · fingerprint 55d662449370Quality control and fly removal
Removed flies are left out of every plot, statistic and table (MATLAB: Condition = NaN).
Spill quality / unconnected / out of range
Fraction of trimmed samples = 4095 (saturated) / ≤ 0 / > 4095, over the recorded samples only; USB dropouts hold the last real value, so their placeholder frames (5000) do not count as out of range. Unconnected channels get unconnected = 1.
InterpretationHigh spill quality = saturated sensor, typically food spilled onto the electrode: events are unreliable.
Code:
core/pipeline.py::run_pipeline · fingerprint d1c39952371dFly removal
Flies to remove (wizard), non-eaters (<= 2 activity bouts; per channel, or per fly when both substrates are at or below it), spill quality > threshold (0.5; with two substrates the whole fly). Removed channels are cleared and their condition set to NaN.
InterpretationExcludes flies that did not engage or whose sensor failed.
Code:
core/post_processing.py::_remove, core/post_processing.py::_remove_substrate_noneaters, core/post_processing.py::_remove_global_noneaters, core/post_processing.py::_remove_spill_quality, core/post_processing.py::_remove_flagged_channels, analysis/statistics.py::_removed · fingerprint 80da3248e27fStatistics
Tests use one value per fly. The Statistics window shows the subplot selected in the plot and names plot, substrate and metric.
Descriptive statistics
n, median, quartiles (MATLAB prctile), mean ± SD (sample SD).
InterpretationMedians and quartiles are the primary summary (skewed data).
analysis/statistics.py::grouped_statistics · fingerprint 0c030283b5c3Pairwise test
Mann-Whitney U, two-sided (= MATLAB ranksum); optional Bonferroni or Holm correction; significance brackets on plots at uncorrected p < 0.05.
InterpretationDifference in distribution location between two conditions. Correct for multiple comparisons when testing many conditions or metrics.
Code:
analysis/statistics.py::pairwise_mann_whitney, analysis/statistics.py::bonferroni_correction, analysis/statistics.py::holm_correction, plotting/style.py::add_significance_bracket · fingerprint 6d5dd78d06f1Omnibus tests
Kruskal-Wallis H (non-parametric) or one-way ANOVA across conditions.
InterpretationWhether any condition differs; follow up with pairwise tests.
analysis/statistics.py::kruskal_wallis_test, analysis/statistics.py::one_way_anova · fingerprint 094b98a130d4Effect sizes
Cliff's delta (share of pairs larger minus smaller) and Cohen's d (pooled SD).
InterpretationSize of a difference independent of n: Cliff |d| < 0.147 negligible, < 0.33 small, < 0.474 medium; Cohen |d| < 0.2 negligible, < 0.5 small, < 0.8 medium.
analysis/statistics.py::cliff_delta, analysis/statistics.py::cohens_d · fingerprint 73534e013526Stimulation vs catch (OptoPad closed loop)
Only for recordings made with an OptoPad rule probability below 1 (FlyPad Acquisition logs the trials and periods in the recording's _events.csv). At every trigger moment the closed loop draws whether to stimulate: a stim trial lit the LED, a catch trial is a moment the draw said no. A stim period lasts from the trigger until the rule's LED went off (after its duration, or when licking stopped in "while licking" mode); a catch period is the same span when the LED stayed off. Event times are raw frame – 53 (trim 4 + detrend 49 samples). Stim and catch are compared per fly with the paired Wilcoxon signed-rank test (flies with at least one of each); these figures are not in the unpaired Statistics window.
Peri-trial sip rate
Sip onsets on the trial's channel in bins of 1.0 s from -10.0 to +30.0 s around each trial, / bin width; bins outside the recording are left out. Per fly: mean over its stim trials and over its catch trials; curves = mean ± SEM over flies.
InterpretationThe time course of feeding aligned to the decision: the catch curve is what the fly does without light at matched moments, so stim – catch is the effect of the light.
Code:
analysis/stim_catch.py::trial_measures, analysis/stim_catch.py::trial_bin_starts, analysis/stim_catch.py::compute · fingerprint 50323d100e3aSips after the trial
Sip onsets on the trial's channel in 0..10.0 s after the trial (left out if the window passes the end of the recording); per fly the mean over trials.
InterpretationImmediate effect on feeding.
Code:
analysis/stim_catch.py::trial_measures · fingerprint 5770253873bcTime until feeding stops
End of the activity run containing the trial moment – trial time; 0 if the channel was not active at the trial.
InterpretationWhether the light cuts the ongoing meal short.
Code:
analysis/stim_catch.py::trial_measures · fingerprint 5770253873bcLatency to feed again
Start of the next activity run – end of the current one (or – trial time if not active); left out if there is no later run.
InterpretationHow long the fly stays away after the meal ends (aversion / satiety).
Code:
analysis/stim_catch.py::trial_measures · fingerprint 5770253873bcStim and catch periods of a fly
With two substrates the channel pair is one fly (its LED is per arena). Stim time = union of its channels' stim periods; catch time = union of catch periods minus stim time (a removed channel's periods still count: the LED lit the whole arena); USB dropouts are cut out of the periods (no events and no time there). An event belongs to the period in which it STARTS (sips, bouts, bursts, active runs); intervals (IFI, bout IBI, burst IBI, insider IBI, transition IBI) only when both ends lie in the same period.
InterpretationCompares behaviour while stimulated with the matched unstimulated time.
Code:
analysis/stim_catch.py::fly_periods, analysis/stim_catch.py::restrict, analysis/stim_catch.py::_restrict_channel, core/pipeline.py::_read_optopad_events, core/events.py::subtract_runs · fingerprint bc494deb5c45Box-plot and microstructure metrics within periods
The Data/Stats workbook metrics computed on the events of the fly's stim and catch periods. Counts (sips, bouts, bursts) and totals (sip, inter-sip, bout duration) are divided by the fly's minutes of that period type; medians are unchanged. Also the preference index (S1 – S2) / (S1 + S2 + 2) of sips and active samples (a fly with either channel removed is left out, as in the recording-long PI), transitions per minute and median transition IBI, and sip-duration / inter-sip histograms per minute of period. Flies removed by the normal analysis stay removed.
InterpretationStim vs catch side by side, each fly's pair joined. Recording-long cumulative time courses are not repeated: periods are short and scattered, so they would mostly show when trials happened; the peri-trial rate is the aligned time course instead.
Code:
analysis/stim_catch.py::median_bout_ibi_within, analysis/stim_catch.py::_pi_values, analysis/stim_catch.py::_transitions, analysis/stim_catch.py::_histograms · fingerprint 984df77798cfPaired Wilcoxon test
Wilcoxon signed-rank test (two-sided) on flies with a value in both stim and catch; n/a for fewer than 2 pairs or all differences 0.
InterpretationWhether stim differs from catch within the same flies.
Code:
analysis/statistics.py::paired_wilcoxon · fingerprint 89751e7903aa