5. Acquire: recording data
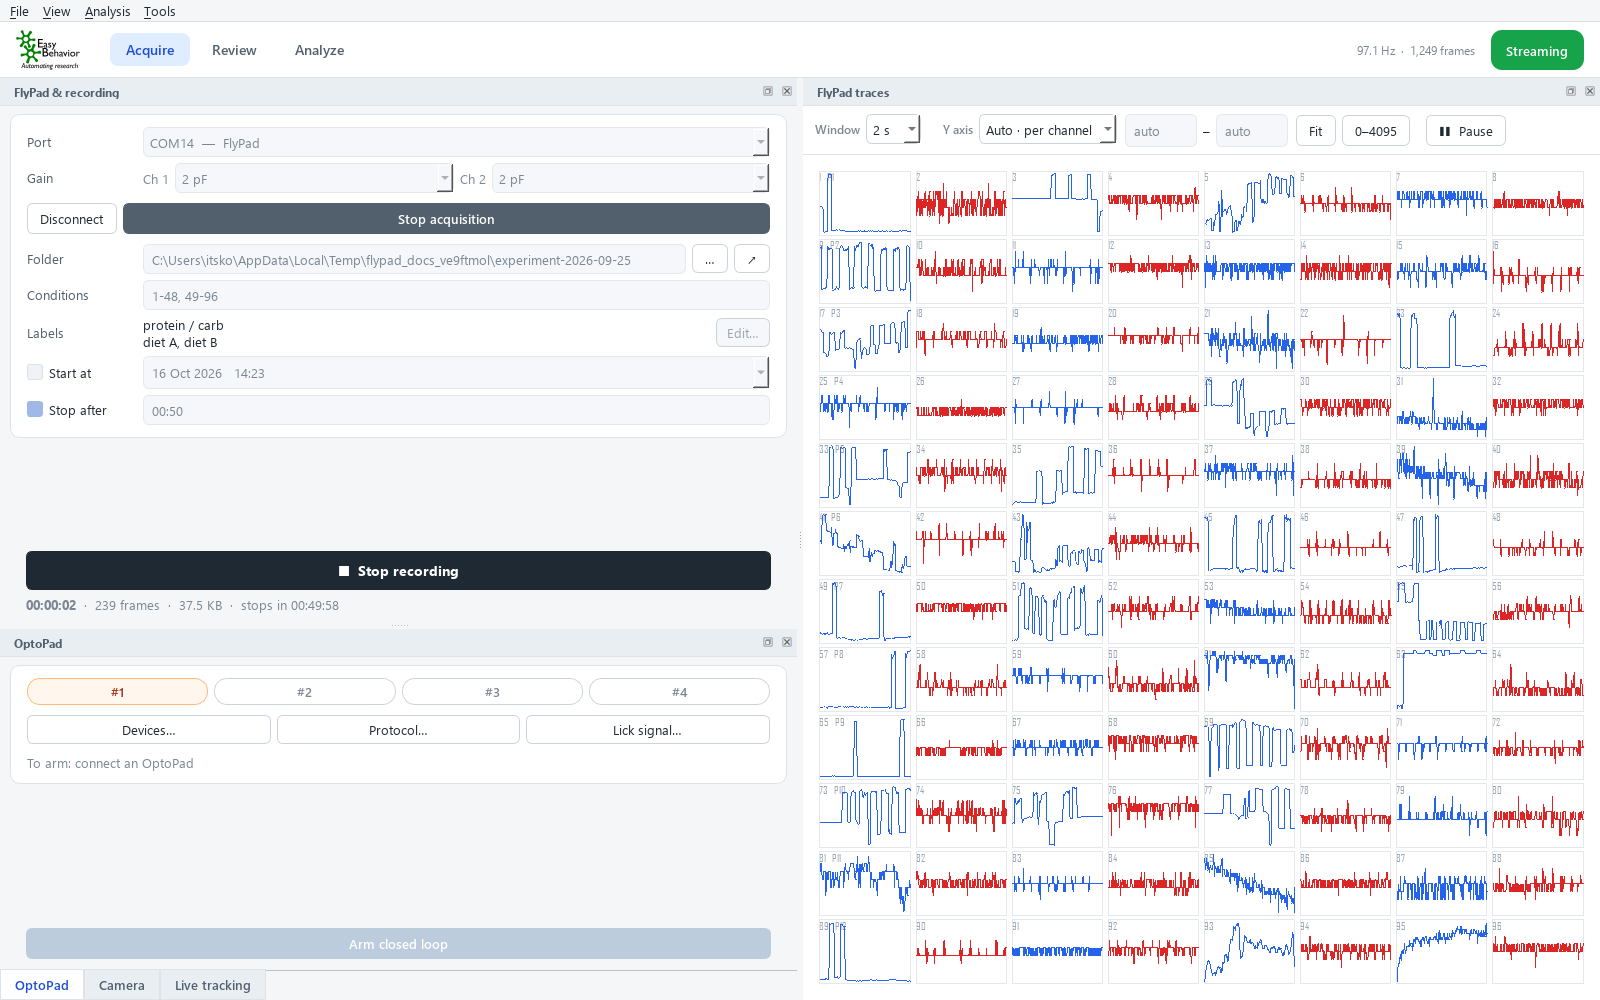
The Acquire page has the cards on the left (FlyPad & recording, OptoPad, and with a camera Camera and Live tracking) and the live view of all channels (FlyPad traces) on the right. Each card can be moved or floated: drag it by its title bar; View → Reset layout puts everything back. The main buttons of each card (Connect, Start acquisition, ● Start recording, Arm, ● Record video) stay visible at its bottom even when the card is scrolled. The indicator at the top right shows the connection state, and next to it the data rate and frame count.
| Indicator | Meaning |
|---|---|
| Disconnected | No FlyPad connected |
| Connected | FlyPad connected, acquisition not started |
| Waiting for data | Acquisition started; the FlyPad has not sent data yet |
| Streaming | Data arriving at 100 Hz |
| Reconnecting | The USB connection was lost; the app retries every 2 s. See Dropouts below |
FlyPad & recording card
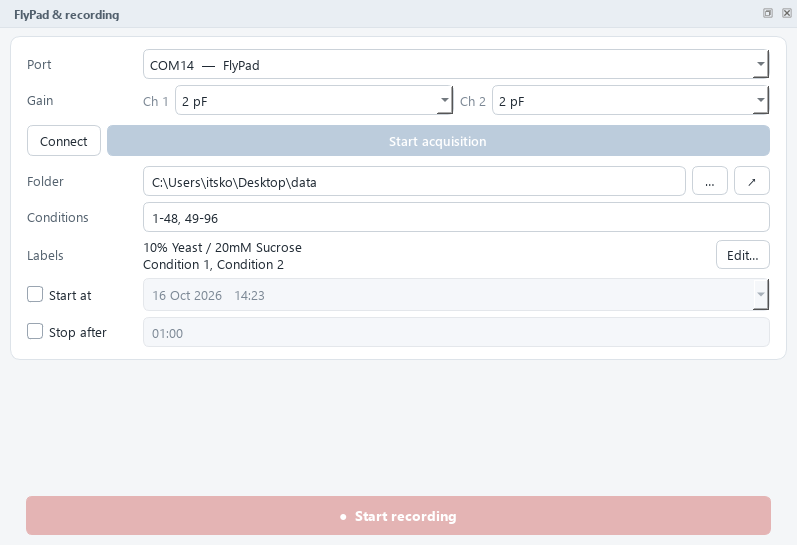
The upper part connects the FlyPad, the lower part records.
-
Port: the list shows only USB devices, each with what it probably is: FlyPad for the basestation, Arduino Mega · OptoPad for OptoPad controllers. The FlyPad is selected automatically. The list refreshes each time you open it.

-
Gain, Ch 1 / Ch 2: the sensor range. 2 pF is the standard setting. A larger range (4 pF) is less likely to saturate but has coarser steps; a smaller one (1 or 0.5 pF) is finer. Gain is applied when acquisition starts.
-
Click Connect, then Start acquisition. The live view starts, and the button changes to Stop acquisition.
Live view
- 12 rows × 8 channels: one row per arena module (P1–P12). The cells are numbered 1–96. Blue = left food (odd channels), red = right food (even channels).
- Window: how many seconds are shown (2, 5, 10, 30 or 60 s).
- Y axis:
- Auto · per channel (default): every channel fills its own cell. This is best for seeing sips.
- Auto · shared: one range for all channels. This is best for comparing channels.
- Fixed: your own minimum and maximum. Fit sets them from the data on screen; 0–4095 shows the full sensor range.
- Pause freezes the display only. Acquisition and recording continue.
What good signals look like. Before food is loaded, the traces are flat with small noise. With food and a fly, each contact appears as a clear step. A channel that is flat at the top or bottom of its range usually has food touching the electrode.
Recording
| Field | What to enter |
|---|---|
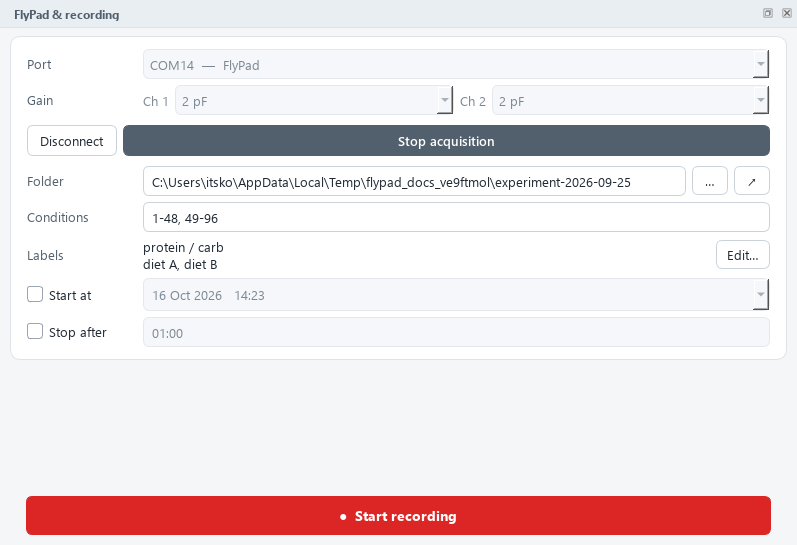
| Folder | Where recordings are saved. … chooses a folder; ↗ opens it in the file explorer. Use one folder per experiment |
| Conditions | The channel range of each experimental group, in order, e.g. 1-48, 49-96. They become part of the file name (C01 = 1–48, C02 = 49–96), and the analysis reads them from there |
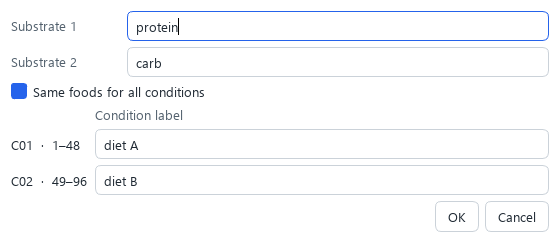
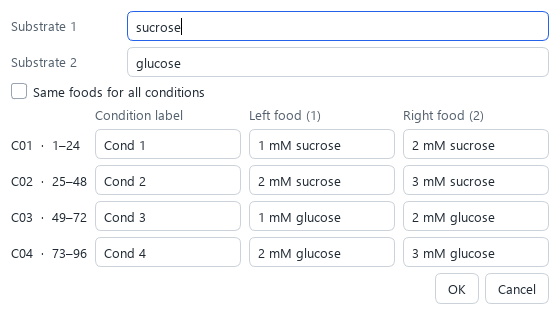
| Labels | Click Edit… to name the two foods (Substrate 1 = left, Substrate 2 = right) and each condition. Untick Same foods for all conditions to give each condition its own pair of foods (see below) |
| File | Appears only when something is wrong with the settings, and says what (see below) |
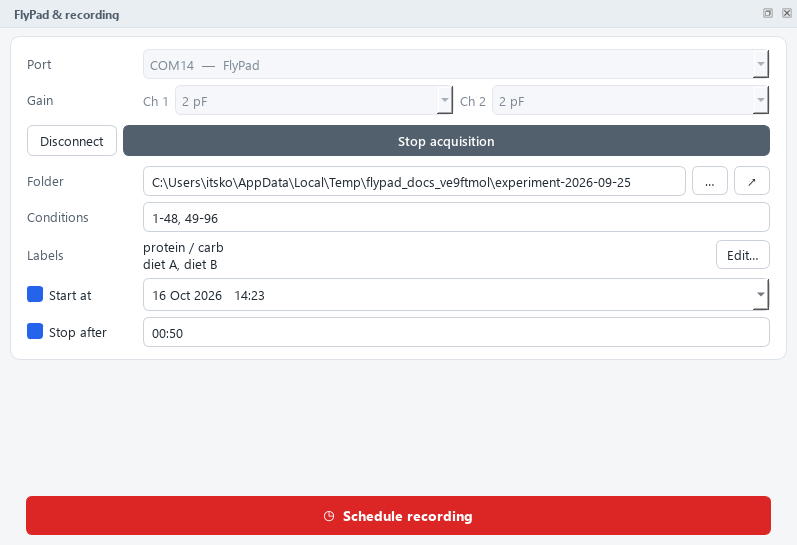
| Start at | Tick to start the recording automatically at a set date and time |
| Stop after | Tick to stop automatically after a set time, as hh:mm, e.g. 00:50 |
Different foods in different conditions
One experiment can compare several food pairs. For example:
| Condition | Channels | Left food | Right food |
|---|---|---|---|
| C01 | 1–24 | 1 mM sucrose | 2 mM sucrose |
| C02 | 25–48 | 2 mM sucrose | 3 mM sucrose |
| C03 | 49–72 | 1 mM glucose | 2 mM glucose |
| C04 | 73–96 | 2 mM glucose | 3 mM glucose |
Enter the four channel ranges as Conditions, open Labels → Edit… and untick Same
foods for all conditions. Each condition then gets its own Left food and Right food
fields; an empty field uses the food entered at the top. A condition with the same food in both
wells is analysed as a single food (total consumption). The foods are saved in the Log_…txt
file, and the analysis uses them in every plot, table and sheet name.
Labels belong to channel ranges: if you change the conditions, each label stays with its range. The file name, the folder and the settings are checked before a recording starts. Overlapping ranges, a relative folder, a Stop after under one minute or a path too long for Windows are reported in the File line, and the recording does not start until they are fixed. Stop acquisition and Disconnect ask for confirmation while a recording runs or the closed loop is armed.
Timed recordings
With Start at ticked, the button reads Schedule recording. Click it and the card counts down to the start time. Acquisition must be running. With Stop after ticked, the file holds exactly the set duration (100 frames per second).
Start and stop
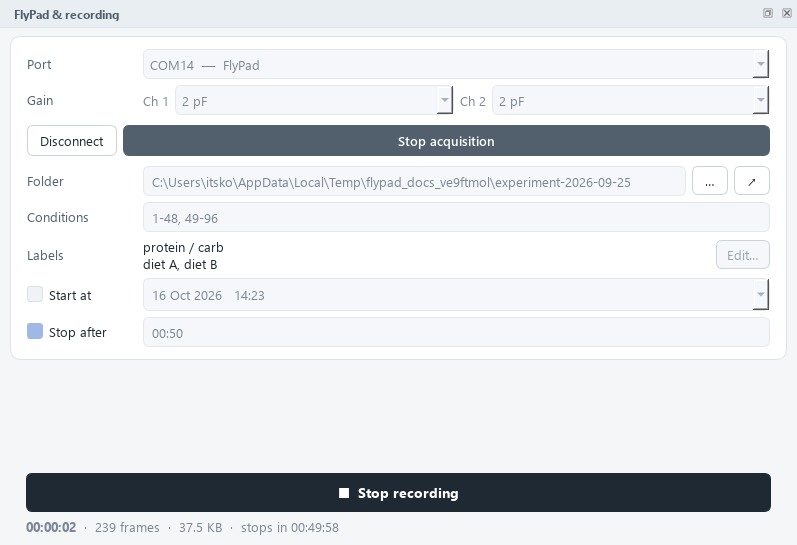
Click ● Start recording. The card shows the elapsed time, the number of frames, the file size and, if timed, when it stops. Click ■ Stop recording to end early. Afterwards the card confirms how many frames were saved.
What is saved
All files go into the chosen folder:
| File | Content |
|---|---|
CapacitanceData_C01_01_48_C02_49_96<date>T<time> |
The raw data: all channels, 100 frames per second, 12-bit values (stored as 16-bit integers), no header and no file extension. This is the standard FlyPad format, read by the analysis |
Log_<date>T<time>.txt |
The labels (foods and conditions), read automatically by the analysis |
…_settings.json |
A snapshot of every setting used for this recording |
…_events.csv |
With OptoPad: every stimulation and catch trial, stim/catch period and LED event, with the frame at which it happened (columns) |
With a camera, the video and its files are saved next to the recording, with the same date and time in the name (see Video files).
The raw data is always saved unprocessed, exactly as measured.
Dropouts and reconnection
If the USB connection drops (a loose cable, or the PC briefly stalls), the app keeps trying to reconnect every 2 seconds. The recording continues. Missing time is filled with placeholder frames (value 5000), so every later sample stays at its true time position. Review shows these gaps, and the analysis handles them. The file never shifts in time.
Tip: the app keeps the PC awake while recording. Disable automatic Windows updates and restarts during long experiments.